Scientists are worried — and with good reason.
Get Started for FREE
Sign up with Facebook Sign up with X
I don't have a Facebook or a X account


 Your new post is loading...
 Your new post is loading...
Your new post is loading...

Marc Bamuthi Joseph for Creative Time Reports: Environmentalism in the US today has come to simply mean buying the right products. What if you can't afford them? Via Anita Woodruff
PIRatE Lab's insight:
Pro-environment does not equal wealthy. 
|
The Los Angeles Zoo will celebrate its 50th anniversary Monday.
PIRatE Lab's insight:
For all their controversy in some quarters, zoos and aquaria clearly played an important role in shaping the public attitude towards wildlife and our greater environment, particularly in the 18th century and in the immediate wake of WWII.
For anyone wishing to take a look at what a misinformation (to be kind) campaign looks like, click here.
PIRatE Lab's insight:
A family member just sent me a text with the subject line "Is this true???" and a link to this posting. So I think it important that I respond with a posting on this story (making the internet rounds thanks to a calculated PR campaign).
The long and short of it is: "no this is not true."
While you can all read this and explore this for yourselves, I would point out that this propaganda blog is a central clearing house for oil-gas/coal industry apologists and is far from an objective or even intellectually honest source of information. There are many great folks in the petroleum industry, but this blog's author is not one of them.
Clues to show that the reality is far different from what is portrayed here:
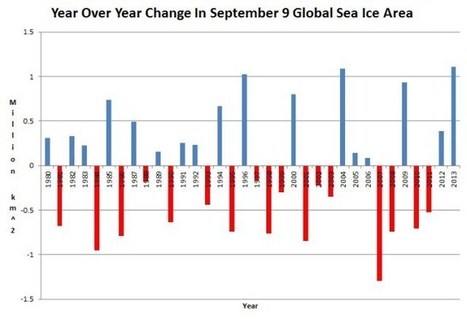
1) No references for the data.
So you cannot verify the voracity to the data (or even know what is being represented...is this supposed to be satellite data? Is this ice of a minimum thickness? etc, etc.). Drilling down to the data (through several links) you get a poorly formatted text file which appears to come from an academic sites, but this is clearly not the data used to generate this graphic. At a minimum, lots of post prcessing of the data with tools most of the general public likely can't figure out would be needed. The idea is to give you the impression that this is real and "sciencey" so don't you go looking into this your ownselves. "Trust us."
2) Playing fast and loose with the facts (assuming these number are actually correct)/assuming you are an uncritical consumer of data.
For example, this graphic is intentionally misleading. What this is actually showing in the order of magnitude change from year to year NOT absolute extent as impled by the title/comments. One of the great aspects of climate change that most of the public is unclear about is the amount of noise being added into our global climate system by a more carbon-rich atmosphere. As we go forward, we will see (and indeed have already seen) major shifts from one year to the next. So last year's conditions are not necessarily predicitve of next year's outcome. This is one of the main reasons we think we are seeing various butterflies disappearing (the insects' lifecycles and those of their plant hosts/food are increasingly out of phase with one another, leading to failed recrecutiment of juvenile butterflies). Just eyeballing these data (again, assuming they are correct) shows that this is indeed happening here: the greatest swings in ice are in the last few years. So even this poor graphic actually makes the case that climate change IS HAPPENING and ushering major changes to our planet.
Everyone that studies climate cycles (or long-term dynamics of natural systems of any kind for that matter) compares conditions to long-term averages. For example a typical comparison is 1950-2000 or (in the case of sea ice) 1981 to 2010. Why wasn't this highlighted here? Oh right, these folks are trying to mislead you...
3) The author of this blog is a former producer for Rush Limbaugh and a former aide to one of the most science-fearing/anti-science Senators' we have had in recent year (Senator Inhofe). He is a frequent commentator for conservative news outlets, but no where else. While this is an ad honium attack, it is nevertheless true and (in this case of propaganda I believe) relevant to this particular subject.
4) This blog clearly has an agenda. While there is nothing wrong with having an agenda, we should always have our baloney detectors up when a decidedly non-expert in a technical subject (i.e. a non-scientist) wants to prove to us that he (they are most often hes and not shes) knows the correct answer to a technical issue. Particulalry when the person only uses cherry-picked "facts" that support his position.
For further reading, you can check out:
http://nsidc.org/arcticseaicenews/
and
http://www.desmogblog.com/directory/vocabulary/4621
|